Oracle8i Parallel Server Setup and Configuration Guide
Release 8.1.5

A67439-01

Library

Product

Contents

Index

Prev Next

7
Monitoring Performance with Oracle Parallel Server Management Charts

This chapter presents the Oracle Performance Manager performance and tuning charts specific to Oracle8i Parallel Server. You must have Oracle Performance Manager installed and configured to display the charts. See Chapter 5, "Installing and Configuring Oracle Parallel Server Management" for further information.

This chapter is meant to only describe Oracle Performance Manager features specific to Oracle Parallel Server. Use this section as a supplement to general information contained in the Oracle Enterprise Manager Performance Monitoring and Planning Guide. This chapter covers the following topics:

See Also:

Oracle Performance Manager Overview

Tuning and performance information for the Oracle Parallel Server database is stored in a set of dynamic performance tables known as the "V$ fixed views". Each active instance has its own set of fixed views. In Oracle Parallel Server, you can have Oracle Performance Manager essentially query a global dynamic performance (GV$) view to retrieve the V$ view information from all instances.

Oracle Performance Manager displays the retrieved information in a variety of tabular and graphic performance statistics for Oracle Parallel Server. The statistics represent the aggregate performance of all instances running on an Oracle Parallel Server. The statistics are displayed in individual charts and include information about data block pings, lock activity, file I/O, and session and user information. You can also use the Performance Manager to display an overview of all of these statistics on one chart.

Oracle Parallel Server performance monitoring is crucial for realizing the full potential of the system. There are several key performance metrics which need to be constantly monitored to keep the Oracle Parallel Server in peak operating condition. The Oracle Performance Manager, available as an applet within Oracle Enterprise Manager, is an application designed to capture, compute, and present performance data that help database administrators focus on key performance metrics.

Oracle Parallel Server performance metrics are compiled into charts that are viewable with Oracle Performance Manager:

Chart   Description  

Parallel Server Block Ping Chart  

Displays the total block pings on the Oracle Parallel Server.  

Parallel Server Data Block Ping by Tablespace Chart  

Displays the block pings per tablespace in the Oracle Parallel Server.  

Parallel Server Data Block Ping by Instance Chart  

Displays the block pings per instance in the Oracle Parallel Server.  

Parallel Server File I/O Rate Chart  

Displays the rate of physical reads and writes for all files in the Oracle Parallel Server database. You can drill down to obtain the same information either at the instance level or at the file level.  

Parallel Server File I/O Rate by Object Chart  

Displays the rate of reads and writes per data file in the Oracle Parallel Server database.  

Parallel Server File I/O Rate by Instance Chart  

Displays the rate of reads and writes per instance in the Oracle Parallel Server database.  

Parallel Server Lock Activity Chart  

Displays the statistics on the lock activity rate for all the different lock types across all Oracle Parallel Servers. You can drill down to obtain lock activity information for a particular lock type at the instance level.  

Parallel Server Sessions Chart  

Displays the sessions attached to the Oracle Parallel Server and related information, such as instance name, session ID, session serial number, process ID, status, and user name.  

Parallel Server Users Logged On Chart  

Displays the total number of user sessions logged on to the Oracle Parallel Server, regardless of whether activity is generated. This information is also available for each instance.  

Parallel Server Users Logged On by Instance Chart  

Displays the number of users logged in to the Oracle Parallel Server by instance.  

Parallel Server Active Users Chart  

Displays the total number of active users on the Oracle Parallel Server.  

Parallel Server Active Users by Instance Chart  

Displays the number of active user sessions.  

OPS Overview Chart  

Displays a group of charts that display key performance statistics for the selected Oracle Parallel Server.  

Starting the Oracle Performance Manager

To use the Oracle Enterprise Manager Console, start the following components:

See "Step 2: Start Oracle Performance Manager Components" for instructions.

Displaying Charts

To display charts:

  1. Following the procedures in "Step 2: Start Oracle Performance Manager Components" and "Step 3: Accessing Oracle Parallel Server Charts".

  2. From within Oracle Performance Manager, double-click Parallel Server from the Databases or Parallel Server Instances folder to see the list of available charts.


  3. From within the Parallel Server object folder, select a chart, then click Show Chart.

    The chart displays in separate window.

Parallel Server Block Ping Chart

The Parallel Server Block Ping chart displays statistics from the GV$PING view on the total number of block pings:
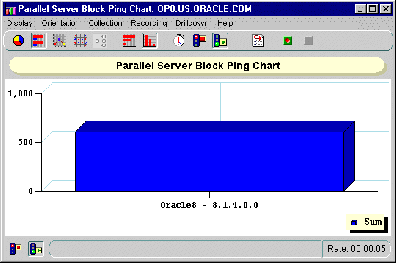
Figure 7-1 Parallel Server Block Ping Chart


To display block pings at the tablespace or instance level:

  1. Click anywhere on the chart.

  2. Right-click and select the chart from the Drilldown menu.

    Chart   Description  

    Parallel Server Data Block Ping by Instance Chart  

    Displays pinging on individual instances.  

    Parallel Server Data Block Ping by Tablespace Chart  

    Displays the pinging on the tablespaces.  

Parallel Server Data Block Ping by Tablespace Chart

The Parallel Server Block Ping by Tablespace chart displays statistics from the GV$PING view on the number of block pings by tablespace:
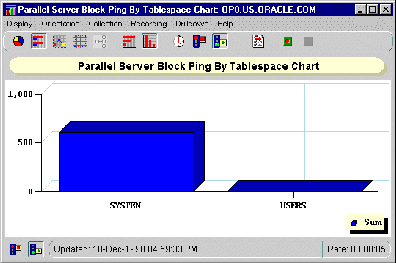
Figure 7-2 Parallel Server Block Ping by Tablespace Chart


To display block pings at the object or instance level:
  1. Click on an individual tablespace.

  2. Right-click and select the chart from the Drilldown menu:

    Option   Description  

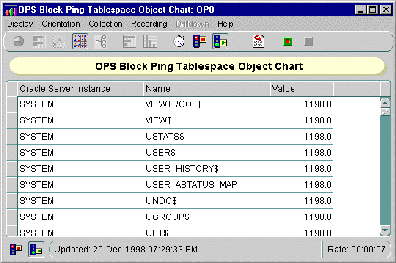
    Parallel Server Block Ping Tablespace Object Chart  

    Displays the objects for the selected tablespace. Objects represent tables, indexes, free extents, clusters of tables, and so on. Listed for each object is the number of pings in the tablespace in which that object resides.  

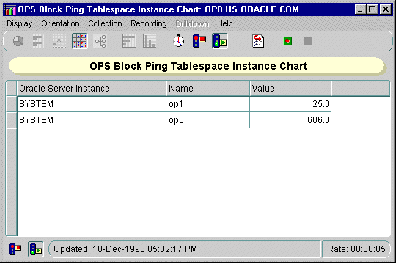
    Parallel Server Block Ping Tablespace Instance Chart  

    Displays the instances within the selected tablespace. Listed for each instance is the number of pings in the tablespace in which that instance resides.  

Figure 7-3 OPS Block Ping Tablespace Object Chart

Figure 7-4 OPS Block Ping Tablespace Instance Chart

Parallel Server Data Block Ping by Instance Chart

The Parallel Server Block Ping by Instance chart displays statistics from the GV$PING view on the number of block pings per instance:
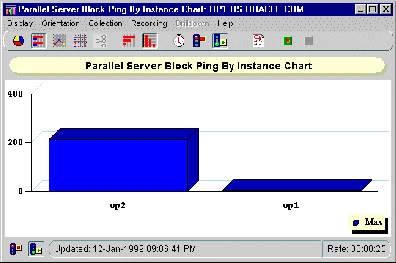
Figure 7-5 Parallel Server Block Ping by Instance Chart


Parallel Server File I/O Rate Chart

The Parallel Server File I/O Rate chart displays physical files reads and writes for all files from the GV$FILESTAT view.
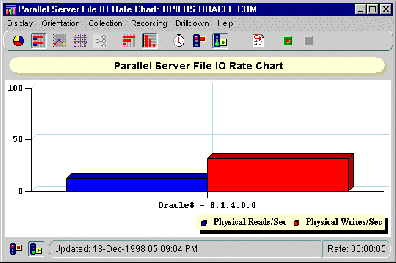
Figure 7-6 Parallel Server File IO Rate Chart


To display the file I/O rate at the instance level or at the file level:

  1. Click on a column's object.

  2. Right-click and select the chart from the Drilldown menu.

    Chart   Description  

    Parallel Server File I/O Rate by Instance Chart  

    Displays the file I/O rate on individual instances.  

    Parallel Server File I/O Rate by Object Chart  

    Displays the file I/O rate on the tablespaces.  

Parallel Server File I/O Rate by Object Chart

The Parallel Server File I/O Rate by Object chart displays physical files reads and writes for individual data files from the GV$FILESTAT view.
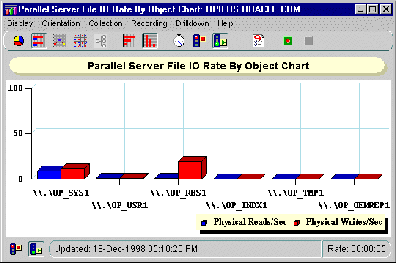
Figure 7-7 Parallel Server Block Ping by Object Chart


Parallel Server File I/O Rate by Instance Chart

The Parallel Server File I/O Rate by Instance chart displays physical files reads and writes for individual instances from the GV$FILESTAT view.
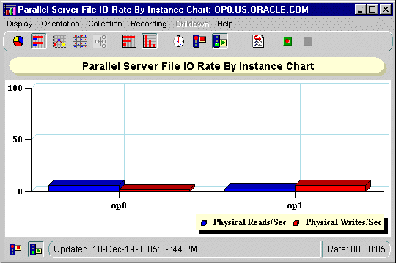
Figure 7-8 Parallel Server File IO Rate by Instance Chart


Parallel Server Lock Activity Chart

The Parallel Server Lock Activity chart shows the number of lock converts of various types (exclusive to null) from the GV$LOCK_ACTIVITY view:
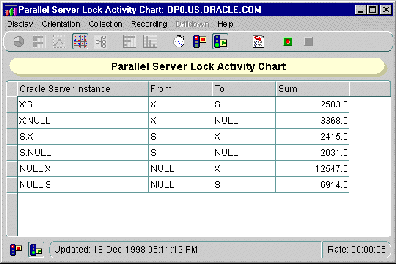
Figure 7-9 Parallel Server Lock Activity Chart


Column   Description  

From  

PCM lock initial state:

NULL; S; X; SSX  

To  

PCM lock final state:

NULL; S; X; SSX  

Sum  

Number of times the lock operation executed  

Parallel Server Sessions Chart

The Parallel Server Sessions chart displays a table of Session IDs. This chart displays statistics from the GV$PROCESS and GV$SESSION and GV$PROCESS views.
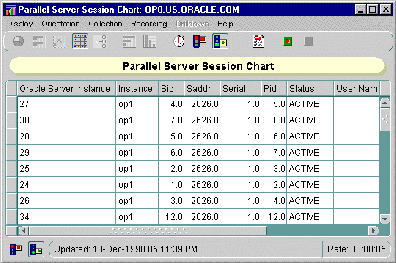
Figure 7-10 Parallel Server Sessions Chart


Column   Description  

Sid  

Session identifier  

Saddr  

Session address  

Serial  

Session serial number. Used to identify uniquely a session's objects. Guarantees that session-level commands are applied to the correct session objects if the session ends and another session begins with the same session ID.  

PID  

Operating system client process ID  

Status  

Status of the session: ACTIVE (currently executing SQL), INACTIVE, KILLED (marked to be killed), CACHED (temporarily cached for use by Oracle*XA), SNIPED (session inactive, waiting on the client)  

User Name  

Oracle user name  

Parallel Server Users Logged On Chart

The Parallel Server Users Logged On chart displays the total number of user sessions currently logged on to the Oracle Parallel Server, whether or not activity is being generated This chart displays statistics from the GV$LICENSE view:
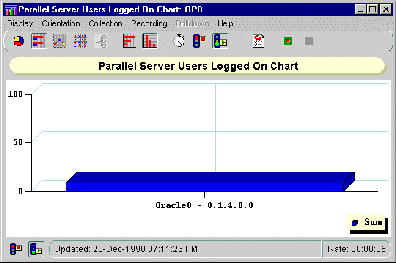
Figure 7-11 Parallel Server Users Logged On Chart


Parallel Server Users Logged On by Instance Chart

The Parallel Server Users Logged On by Instance chart displays the number of users logged on to each instance in the Oracle Parallel Server. This chart displays statistics from the GV$LICENSE view.
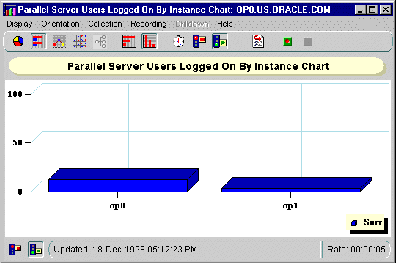
Figure 7-12 Parallel Server Users Logged On by Instance Chart


Parallel Server Active Users Chart

The Parallel Server Active Users chart displays the total number of user active sessions. This chart displays statistics from the GV$LICENSE view:
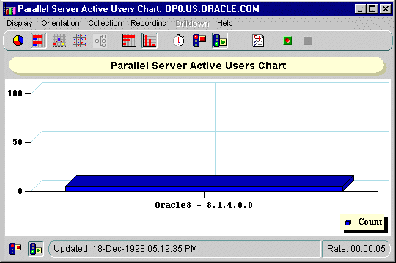
Figure 7-13 Parallel Server Active Users Chart


Parallel Server Active Users by Instance Chart

The Parallel Server Active Users by Instance chart displays the number of active user session logged on to each instance in the Oracle Parallel Server. This chart displays statistics from the GV$LICENSE view.
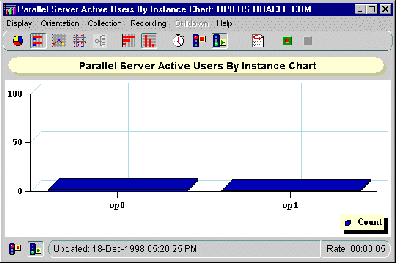
Figure 7-14 Parallel Server Active Users by Instance Chart


OPS Overview Chart

The OPS Overview chart displays the following charts:
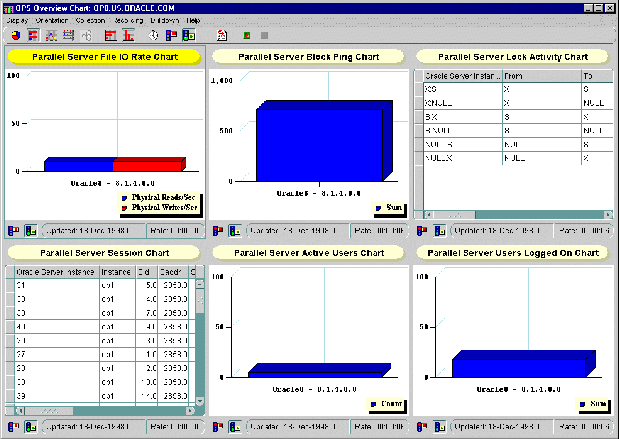
Figure 7-15 Overview Chart


Prev

Next
Oracle
Copyright © 1999 Oracle Corporation.

All Rights Reserved.

Library

Product

Contents

Index