Stepping
All debuggers offer the ability to step through the execution of your program. Eclipse presents this capability in the Stack Frame Window that is part of its debugging perspective. The three key features that will allow you to trace the execution are:
- Step Over
- Step In
- Step Return
You can use each tool when the execution has been paused as a result of a breakpoint being reached. Eclipse will gather all the information about the state of the call stack and show the line that is about to be executed in a shaded blue.
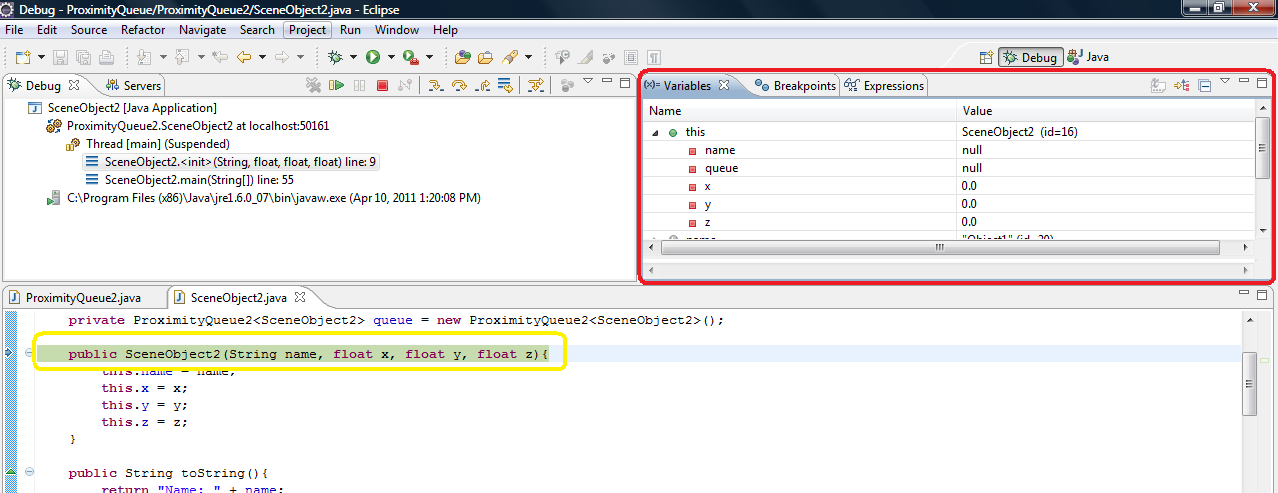
The information gathered by Eclipse contains the current state of the call stack. This includes the current state of all variables that exist in memory at that particular time during execution. You can view these in the "Variables" Window. These windows, when used correctly, are a more time efficient way of probing the state of variables.
You can move through the call stack by selecting a different frame from the Stack Frame Window. The values displayed in the Variables Window may change depending on what had occured between frames (i.e., the statements that were executed between each).
Stepping
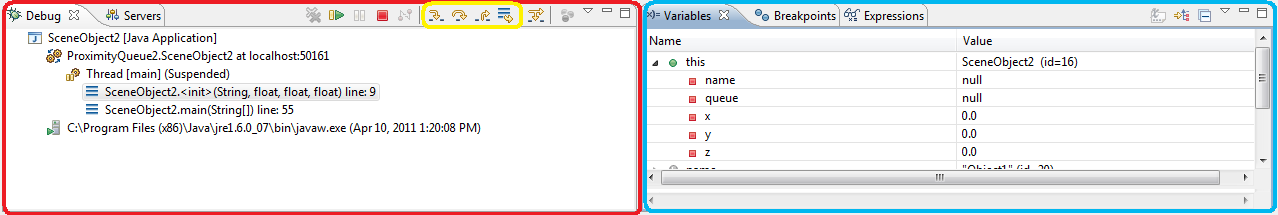
You can advance the execution of your program using the step tools.
 (Hotkey: F5) Step Over — will execute the current line where your program was paused. You can see any changes in value in the Variables Window.
 (Hotkey: F6) Step In — will step into the methods that exist on the current line. This will add a frame into the Stack Frame Window and may change the values shown in the Variables Window depending on what variables are local to that stack frame.
 (Hotkey: F7) Step Return — will return to the previous stack frame where you or your execution had to step in. This will update the values shown in the Variables Window.