Release 8.0.3
A54894-01
Library |
Product |
Contents |
Index |
| Oracle8(TM)
Getting Started for Windows NT Release 8.0.3 A54894-01 |
|
This chapter describes how to monitor Oracle8.
Specific topics discussed are:
The following tools/procedures enable you to monitor your Oracle8 database.
Each tool/procedure is described in the following sections.
| Additional
Information:
See Oracle8 Server Tuning for general tuning information and your operating system documentation for additional information on Windows NT Performance Monitor results and optimizing database performance. |
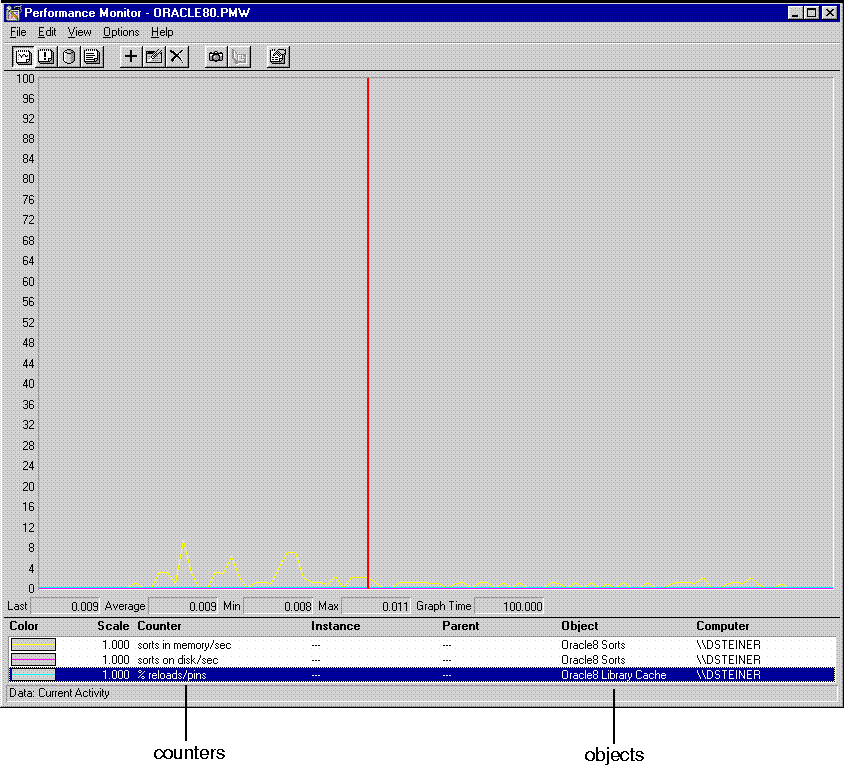
Oracle8 Performance Monitor is a graphical tool for measuring the performance of Oracle8 Enterprise Edition objects on the local server or other servers on a network. This tool is the same in appearance and operation as the Windows NT Performance Monitor, except it has been preloaded with Oracle8 database performance elements.
On each computer, you can view the behavior of objects, such as the buffer cache, data dictionary cache, data files, threads, and processes. An object is a graphical representation of an element in your system. Every element, resource, and device in your system can be represented as an object.
There is a set of counters associated with each object. A counter is a unit of measurement used by the Performance Monitor to display activity. The type of activity the counter measures is dependent upon the type of object.
Certain object types and their respective counters are present on all systems. Other counters, such as application-specific counters (like Server Manager), appear only if the computer is running the associated software.
Each of these objects has an associated set of counters that provide information about device usage, queue lengths, delays, and information used to measure throughput and internal congestion.
To use the Oracle8 Performance Monitor to monitor and analyze Oracle8 for Windows NT database performance, you must first install the Oracle8 Performance Utility. The Oracle8 Performance Utility enables the Windows NT Performance Monitor to monitor Oracle8 database objects.
When you install the Oracle8 Performance Utility, values are automatically set in the Windows NT Registry as described in Appendix C, "Configuration Parameters and the Registry".
The Oracle8 Performance Monitor allows you to monitor only one database
instance at a time. For this reason, the registry contains the following
values located in HKEY_LOCAL_MACHINE\SYSTEM\CURRENTCONTROLSET\SERVICES
\ORACLE80\PERFORMANCE that point to a particular database instance:
| Note:
Oracle Corporation recommends setting the security level on each of these registry values. |
To use the Oracle8 Performance Monitor for another database instance on the same machine or a UNIX machine, change the values appropriately in the registry. You can also monitor non-NT Oracle databases by changing the Hostname registry value so it points to another machine specified in the TNSNAMES.ORA file.
To access the Oracle8 Performance Monitor:
Choose Start>Programs>Oracle for Windows NT>Oracle8 Performance Monitor.
The Performance Monitor window appears with the Chart View:

The Performance Monitor has four different views you can choose from the View menu:
| Additional
Information:
For complete information about the four views, see your Windows NT documentation. |
For each view (Chart, Alert, Log, Report), you can decide on the objects you want to monitor and save those settings to a file. When an object is chosen, it is assigned a counter, a color, and added to the status bar at the bottom of the Oracle8 Performance Monitor.
To add objects to a view:
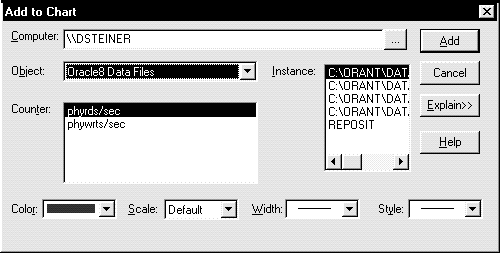
The Add to (Chart, Alert, Log, Report) dialog box appears.
Below is the Add to Chart dialog box. Note the corresponding dialog boxes for the other views have differences.

Below are the components of the Add to Chart dialog box. The other views' dialog boxes have similar features.
|
Note: You can only monitor one instance at a time using Performance Monitor on a given machine. |
All Oracle8 system resources that can be monitored through Oracle8 Performance Monitor begin with Oracle8. These measures are defined in ORACLE_HOME\DBS\PERF80.ORA. The following table shows the Oracle8 objects and their associated counters.
| Note:
For additional information on these objects, see the Oracle8 Server Tuning. |
| Object | Counter | Description |
|---|---|---|
|
Oracle8 Buffer Cache |
phyrds/gets % |
The percentage of phyrds/gets is calculated as a Miss ratio. If the Miss counter is higher than 30% to 40%, increase the number of buffers in the buffer cache to improve performance. To make the buffer cache larger, increase the value of the DB_BLOCK_BUFFERS initialization parameter. This value is not time-derived. |
|
Oracle8 Data Dictionary Cache |
getmisses/gets % |
The value of this counter must be less than 10 or 15% for frequently accessed data dictionary caches. If the ratio continues to increase above this threshold while your application is running, increase the amount of memory available to the data dictionary cache. To increase the memory available to the cache, increase the value of the initialization parameter SHARED_POOL_SIZE. (See Oracle8 Server Tuning for more detailed information on tuning memory allocation in the Oracle8 database.) This value is not time-derived. |
|
Oracle8 Data Files |
|
Disk contention occurs when multiple processes try to access the same disk simultaneously. There are many ways of reducing disk contention, depending on the results from monitoring disk activity. Some corrective actions include:
These values are time-derived. |
|
Oracle8 DBWR stats1 |
|
These counters are helpful in tuning the Buffer Cache. |
|
|
|
Buffers scanned/sec is the number of buffers the DBWR scanned per second. The buffers scanned are on the LRU list. |
|
|
|
LRU_scans/sec is the number of times the DBWR scanned the List Recently Used buffer list per second. |
|
Oracle8 DBWR stats2 |
|
These counters are helpful in determining how much work the DBWR has been requested to perform. |
|
|
|
Timeouts/sec is the number of times the DBWR timed-out per second. The DBWR is on a three seconds timeout interval. If the DBWR has not been posted within a three second interval, it times out. |
|
|
|
Checkpoints/sec is the number of checkpoint messages processed by the database writer per second. Whenever a check point occurs, the DBWR must be messaged (posted) to "write dirty buffers to disk". |
|
Oracle8 Dynamic Space Management |
recursive/calls per second |
Dynamic extension causes Oracle8 to execute SQL statements in addition to those SQL statements issued by user processes. These SQL statements are called recursive calls. If Oracle8 makes excessive recursive calls while an application is running, it may be necessary to determine the cause. Examine the recursive calls statistic through the dynamic performance table V$SYSSTAT. |
|
Oracle8 Free List |
freelist waits/ requests % |
Contention for free lists is reflected by contention for free data blocks in the buffer cache. You can determine if contention for free lists is reducing performance by querying V$WAITSTAT. If the number of freelist waits for free blocks is greater than 1% of the total number of requests, consider adding more free lists to reduce contention. |
|
Oracle8 Library Cache |
reloads/pins % |
The percentage of SQL statements, PL/SQL blocks, and object definitions that required reparsing. Total Reloads must be near 0. If the ratio of Reloads to Pins is greater than 1%, then reduce the library cache misses. This value is not time-derived. |
|
Oracle8 Redo Log Buffer |
redo log space requests |
The value of this counter must be near 0. If this value increments consistently, processes have had to wait for space in the redo log buffer. In this case, it may be necessary to increase the size of the redo log buffer. |
|
Oracle8 Sorts |
|
The default sort area size is adequate to hold all the data for most sorts. However, if your application often performs large sorts on data that does not fit into the sort area, then you may want to increase the sort area size. |
The following list describes information specific to Oracle8 database when you use the Oracle8 Performance Monitor.
If no data or Oracle8 objects appear, either the database is not running, or an invalid host string or password has been entered in the registry.
The OPERF80.LOG file located in ORACLE_HOME\DBS contains error messages about the Oracle8 Performance Monitor.
To resolve this problem:
Oracle8 Enterprise Edition problems and other significant occurrences are recorded as events. These events are recorded in an application event log. You view and manage these recorded events in the Event Viewer.
| Additional
Information:
See your operating system documentation for more information on using the Windows NT Event Viewer. |
To access the Event Viewer:
The Event Viewer window appears.
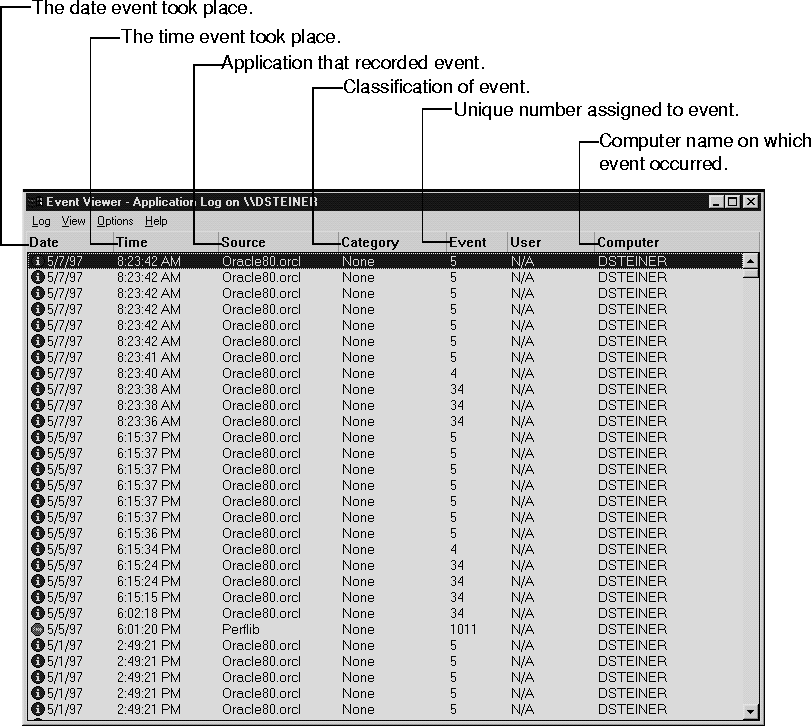
The Application view appears:

The icons beside each event determine the type of event.
Oracle8 events display with a source of Oracle80.orcl. Oracl80.orcl consists of the following event IDs:
To use the Event Viewer:
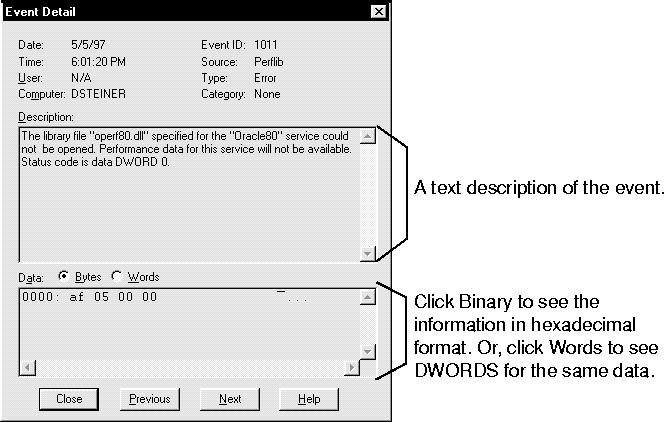
The Event Detail dialog box appears with more information about the selected event:

Oracle8 for Windows NT background threads use trace files to record occurrences and exceptions of database operations, as well as errors. Background thread trace files are created regardless of whether the BACKGROUND_DUMP_DEST parameter is set in the initialization parameter file. If BACKGROUND_DUMP_DEST is set, the trace files are stored in the directory specified. If the parameter is not set, the trace files are stored in the ORACLE_HOME\RDBMS80\TRACE directory.
Oracle8 database creates a different trace file for each background thread. The name of the trace file contains the name of the background thread, followed by the extension .TRC. Sample trace file syntax includes:
where SID represents the name of the instance.
Trace files are also created for user threads if the USER_DUMP_DEST parameter is set in the initialization parameter file. The trace files for the user threads have the form ORAxxxxx.TRC, where xxxxx is a 5-digit number indicating the Windows NT thread ID.
The alert file contains important information about error messages and exceptions that occur during database operations. Each Oracle8 instance has one alert file; information is appended to the file each time you start the instance. All threads can write to the alert file.
For example, when automatic archiving of redo logs is halted because no disk space is available, a message is placed in the alert file. The alert file is the first place to check if something goes wrong with the database and the cause is not immediately obvious.
The alert file is named SIDALRT.LOG and is found in the directory specified by the BACKGROUND_DUMP_DEST parameter in the initialization parameter file. If the BACKGROUND_DUMP_DEST parameter is not set, the SIDALRT.LOG file is generated in ORACLE_HOME\RDBMS80\TRACE.
Oracle Corporation offers an optional Performance Pack attachment to Oracle Enterprise Manager that consists of the following integrated monitoring and tuning applications:
The Performance Pack is a powerful set of performance monitoring and tuning tools designed to provide real-time graphical performance information to customers who need to manage their dynamic database environments.
Oracle Enterprise Manager contains the following optional performance monitoring applications:
Oracle Performance Manager is a tool for monitoring database performance in real time. It provides dozens of predefined charts for displaying a wide variety of database performance statistics regarding:
| Additional
Information:
See the Oracle Enterprise Manager Performance Monitoring User's Guide for specific information on using this tool. |
Oracle TopSessions enables you to monitor how connected sessions use database-instance resources in real time. You can obtain an overview of session activity by displaying the top n sessions sorted by a statistic of your choosing. For any given session, you can then drill down for more detail. You can further customize the information you display by specifying manual or automatic data refresh, the rate of automatic refresh, and the number of sessions to display.
In addition to these useful monitoring capabilities, Oracle TopSessions provides a methodology for identifying and correcting certain database performance problems. For example, when a sudden file I/O load is detected, you can first identify the sessions contributing to most to the problem, and then isolate the executing SQL statements in user applications for those sessions. You can then analyze the SQL explain plans for those SQL statements to determine how best to resolve the problem.
| Additional
Information:
See the Oracle Enterprise Manager Performance Monitoring User's Guide for specific information on using this tool. |
With Oracle Lock Manager you can monitor locks, which are mechanisms that prevent destructive interaction between users accessing the same resource.
The main window displays a multi-column list that includes a row for each current lock in the database. The information displayed in the columns includes:
| Additional
Information:
See the Oracle Enterprise Manager Performance Monitoring User's Guide for specific information on using this tool. |
Oracle Tablespace Manager enables you to monitor and manage tablespace fragmentation. You can display an overview table of space usage information, either for all tablespaces in a database, or for the datafile(s) within a tablespace.
To find out more about a given tablespace or datafile, you can click further to display how storage has been allocated for its segments. Clicking on a segment in a segment list displays the extents in the tablespace or data file storing data for that segment. If data storage for a segment is fragmented, you can defragment it. You can also use the coalescing feature of Oracle Tablespace Manager to join adjacent free blocks.
| Additional
Information:
See the Oracle Enterprise Manager Performance Monitoring User's Guide for specific information on using this tool. |
To start these applications from the Oracle Enterprise Manager Console, first select a database instance in the Oracle Enterprise Manager navigator tree with which to establish a connection. Then, proceed in one of two ways:
Oracle Trace is a general-purpose data collection product that captures data for specific software events, such as an application transaction, a user log on, or any event particular to the software product. With Oracle Trace, you can collect a wide variety of data, such as performance statistics, diagnostics data, system resource usage, and business transaction details.
Two Oracle Corporation products are currently enabled for Oracle Trace collection:
The Oracle Server performance data collected by Oracle Trace includes SQL statements, detailed statistics on SQL events, transactions events, and other useful information.
Oracle Trace provides a graphical Oracle Trace Manager application to create, schedule, and administer Oracle Trace collections for host products containing the Oracle Trace application programming interface (API). You can store data collected by Oracle Trace in Oracle8 database tables for access by SQL reporting tools and other products.
Oracle Trace has an API that contains data collection service calls. Software developers can use the Oracle Trace API to pre-configure their products for Oracle Trace data collection. Users of a product containing the Oracle Trace API calls, such as the Oracle8 database, can then automatically use Oracle Trace to collect data about specific events that occur in that product.
Most Oracle Trace users perform collections for products that already include the Oracle Trace API. Therefore, most users only need to be familiar with the data that can be collected for the host product and how to use the Oracle Trace Collection Manager application to create and administer data collections.
| Additional
Information:
See the Oracle Enterprise Manager Oracle Trace User's Guide for specific information on using this tool. |
To start Oracle Trace Oracle from the Enterprise Manager Console in one of two ways:
Oracle Expert enables you to optimize the performance of your database environment. It assists you with the initial Oracle8 database configuration and the collection and evaluation of the performance characteristics of existing databases. Oracle Expert provides many advantages. Oracle Expert:
Oracle Expert also serves as:
| Additional
Information:
See the Oracle Enterprise Manager Expert User's Guide for specific information on using this tool. |
To start Oracle Expert from the Oracle Enterprise Manager Console:
|
Copyright © 1997 Oracle Corporation. All Rights Reserved. |
|