Homework 5: Classification and Clustering with Weka
out Tuesday, May 2, due Sunday, May 14
This assignment asks you to download and install Weka and use it to explore four machine learning modules.
This homework includes two versions of the zoo dataset, zoo_original.arff which is the original based the UCI data with 101 instances, and zoo_big.arff which is a version with an additional 113 instances added. The additional data was found on the Kaggle's Zoo Animals Extended Dataset and includes 43 animals from several classes except Mammals and Birds (as these latter classes are very frequent in the original dataset); and 70 animals from species maintained by São Paulo Zoo, being primarily animals of the Brazilian fauna in danger of extinction.
We've also included a file zoo_small.arff with few instances that you are welcome to experiment with and a file zoo_big.csv that you can load into a spreadsheet like excel to more easily view and sort the data.
You will use the following algorithms in this homework exercise: Decision Tree, SVM, Naive Bayes Classifier, and K-Means clustering.
We will step you through the process and along the way, you will save data and answer questions in the file myhw5.md in your repository. You can edit this in any text editor. Some, such as VS Code and the free atom editor, can preview how the markdown will look. When you are done, you should commit and push myhw5.md.
If you want, you can review some of the many Weka tutorials that are online, such as a this one.
0. Checkout the HW5 repository
Checkout your copy of the HW5 repository.
1. Install Weka and add the libSVM classifier
Go to the weka site and and download and install the Weka system for your computer (mac, windows, linux). Weka requires java. You will not need to program in java, but so you may need to install it on your computer. Start weka using either the weka.exe, weka.sh, weka.app or using the following command (java -jar weka.jar). You should see this window.

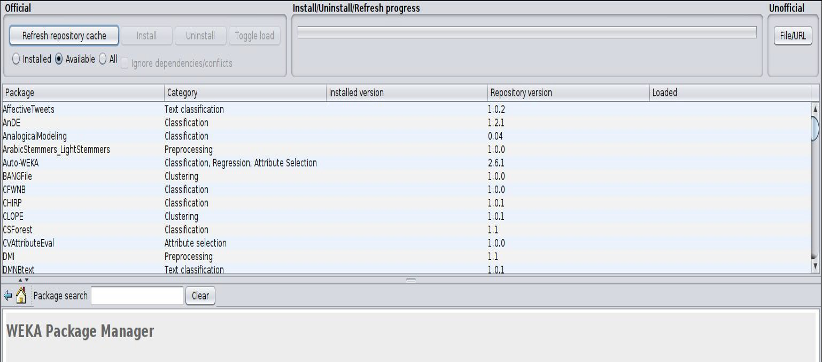
Weka comes with a large library of machine learning packages and some need to be installed before you can use them, including a basic SVM classifier. In the navigation bar at the top of the Weka app window, select Tools ==> Package Manager to open the package manager from which you can load extra packages. Scroll down through the different tools until you see libSVM. Select it, click install, and exit the Package Manager

2. Exploring the zoo datasets
Click on the Explorer button in the Weka app to begin exploring the data. Select the preprocess tab to load one of the arff data files from your local HW6 repository. Weka may start at your home directory so you may have to navigate down to your HW5 directory to access the data files. You should see two local arff datasets: zoo_big.arff and zoo_original.arff. Open zoo_big.arff.

This part of the assignments asks "How many attributes are there?" about the datasets. What counts as an attribute? Here's some you should think about and do before you answer.
For the zoo datasets, the values for the first entry for each row (labeled animal) is the name of the animal. It's different for each row. So it is clearly there as a extra information humans to better understand the dataset and to use their prior knowledge about the domain to see if the data makes sense.
Since it's different for every instance (i.e., row) it cannot help a ML algorithm learn a general model for any of the classes (e.g., mammal). So, you should remove this attribute from the data before applying a Weka algorithm. Depending on the algorithm and the parameters used, leaving it in can reduce the accuracy of the model it generates.
After your load the data in the pro processing step, you can easily remove one or more of the attributes by selecting them in the Attributes window and clicking on the remove bar below the window.
So when asked "How many attributes are there?", your answer might mention this issue in addition to giving a number.
Answer the first four questions in your myhw5.md file about this dataset. To do the last one, try selecting the checkbox for the 'type' attribute to see the class distribution.
Q1. How many classes are there in the zoo_big.arff dataset?
Q2. How many attributes are there?
Q3. How many examples are there?
Q4: How many examples are there for each of the classes?
Now open the zoo_original.arff file and answer the same four questions about it.
Q5. How many classes are there in the zoo dataset contained in the zoo_original.arff dataset?
Q6. How many attributes are there?
Q7. How many examples are there?
Q8: How many examples are there for each of the classes?
3. Classifying the zoo datasets
For this part you will open each data set and run three classifiers on each of the datasets. The classifiers are:
- The J48 decision tree classifier
- The libSVM classifier
- The Naive Bayes classifier
The best way to do this is to start with the first dataset zoo_big.arff and run each algorithm and then do the same for zoo_original.arff. for each of the classifier algorithms and each of the datasets, you should collect three numbers: the true positives, the true negatives and the F-measure.
Select the classify tab to run any of the classifiers. Weka assumes that the last attribute is the target, i.e., the one we want to predict. If you wanted to change this, you can select another one using the selector just above the start button. It should be initially show (Nom) type, which is the last attribute. You can select a classifier to apply using the Choose button. Pressing this brings up a menu that initially shows sub-menus for the different types of classifiers, e.g., bayes, functions, lazy ... tree.
3.1 Zoo_big.arff
Close any open dataset and open the one you want to experiment with. Once it is loaded, select the ‘classify’ tab in weka.
3.1.1. First select the J48 algorithm by clicking the ‘choose’ button and expanding ‘trees’ in the classifier explorer and finally clicking on J48. Select Percentage split and 66%. This will split the data in to 2/3 of the instances for training and 1/3 for testing. Hit the Start button. Observe your results. You will see how the tree was constructed, how many instances were correctly classified, how many were incorrectly classified, and a nice confusion matrix. Put the key results, true-positive (TP) rate, false-positive (FP) rate and F-measure, into your myHW5.md file for this experiment.
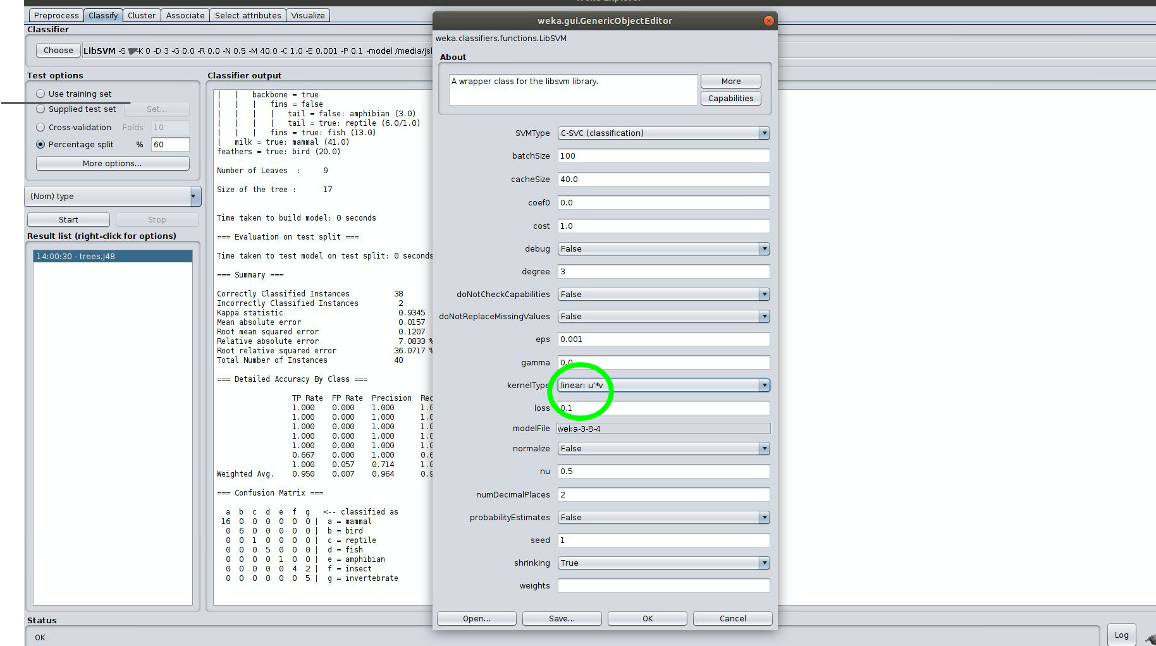
3.1.2 Choose the SVM classifier located under ‘functions’ in the classifier explorer. Click on the window where the SVM command is listed to open the hyperparameter form. Change the kernel to be a linear kernel. You should get similar output, i.e., how many instances were correctly classified, how many were incorrectly classified, and a nice confusion matrix. Populate your results, TP, FP and F, into myhw5.md.

3.1.3 Do the same thing for a Naive Bayes classifier and add your results to myhw5.md
3.2 Zoo_original.arff
Repeat the process running each of the three classifiers on the zoo_original.arff dataset and adding the key results to myhw5.md
3.3 Consider your results
Answer these questions in your myhw5.md file
Q9: How did your results from each classifier compare when processing the zoo_big data set? Which one was better? Were you surprised?
Q10: How did your results from each classifier change when processing the zoo_original data set?
4. Clustering the data
Go back to the ‘preprocess’ tab and close this dataset and open the zoo_big.arff dataset. This time we will look at clustering using K-Means.
- Switch to the ‘clustering’ tab and select K-means clustering.
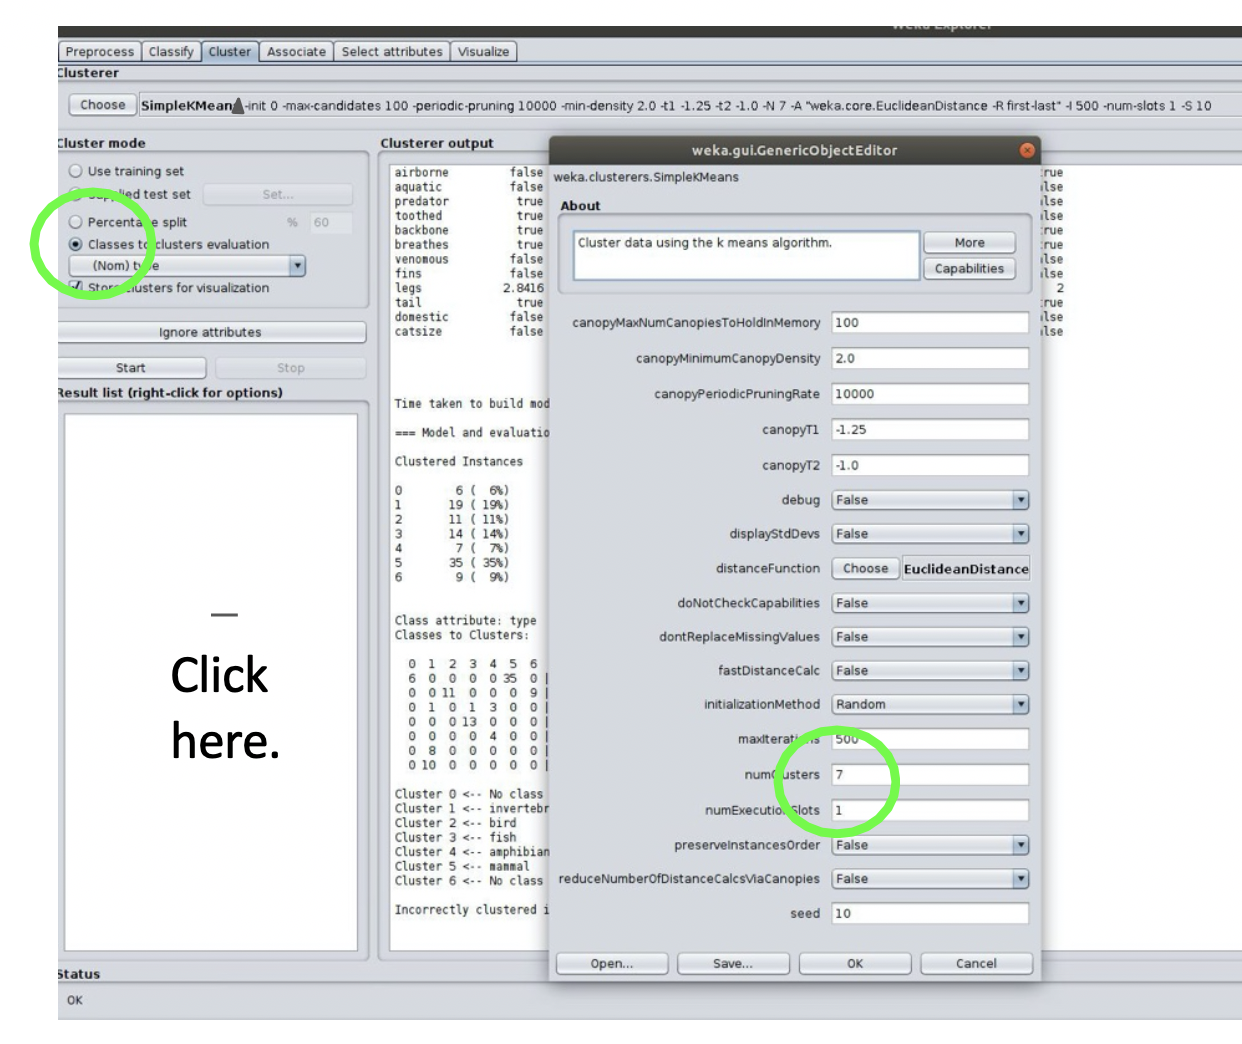
- Click the window where it lists the SimpleKMeans algorithm and change the size of K to 3.
- Under Cluster Mode, select the button for classes to cluster evaluation and choose type. This will show an evaluation of the clustering using the true y values in the data.
- Then click start.

With clustering using the classes to clusters evaluation mode, we can get a good idea as to how well it clustered based on the information provided. Here we had three clusters, and it shows us how many of each type was clustered under each cluster. We can also see the incorrectly clustered instances and their percentage.

Note the key metric, the number of incorrectly clustered instances in myhw5.md in questions Q11. Then repeat the experiment for K=5, K=7, and K=9 and add the results to myhw5.md in Q12-Q14.
Now repeat the process for the zoo_original.arff dataset and enter the values for K=3, 5, 7 and 9 in questions Q15-Q18.
Based on your results, add your answer to the following question in myhw5.md.
Q19: Characterize the results of the four clustering experiments on the two datasets
Q20: Can you identify which types might be most similar and which types might benefit from being divided into subtypes?
What and how to submit
Submit your edited myhw5.md file by committing and pushing it back to your repository.
| 